With the US Dollar index falling even lower today, below we highlight the historical bull and bear markets of the currency.
As shown, market cycles for the currency are longer than some of the other asset classes that we have looked at. The average bull market for the US Dollar is 1,710 days long for an average gain of 48.90%. The average bear market is 1,610 days for an average decline of 31.84%.
Based on these averages, the current bear market is both longer in duration and more extreme in its decline. Since the current bear market in the US Dollar started in July 2001, currency has declined 37.69%.
click to enlarge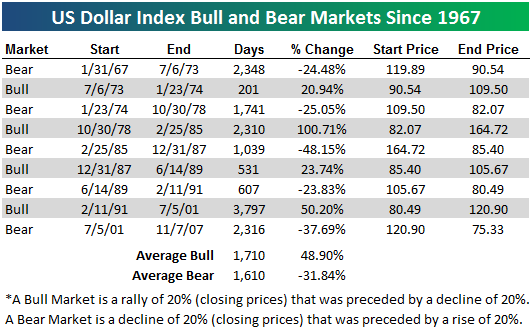
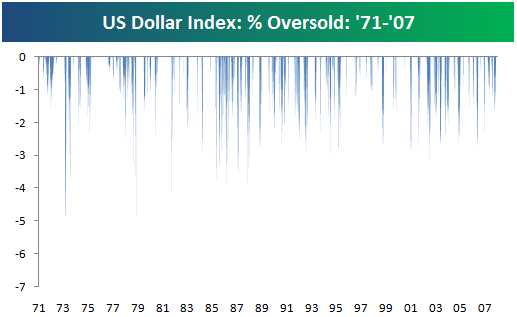
Below we highlight a historical price chart of the US Dollar index. As shown, we're currently at record lows. However, the currency isn't nearly as oversold as it has been in the past based on its distance from its 50-day moving average. Currently, the US Dollar is 2.25% below the bottom of it trading range.
As highlighted in the second chart below, the Dollar has reached oversold levels of 3% to 4% quite frequently.

No comments:
Post a Comment